Parent Project
Overview
- Introduction
- Goals
Project Documentation

This plugin uses the graphviz command line tool 'dot' to generate a graphical representation of the project dependencies. You will need to install it and add it to your PATH before you can use this plugin.
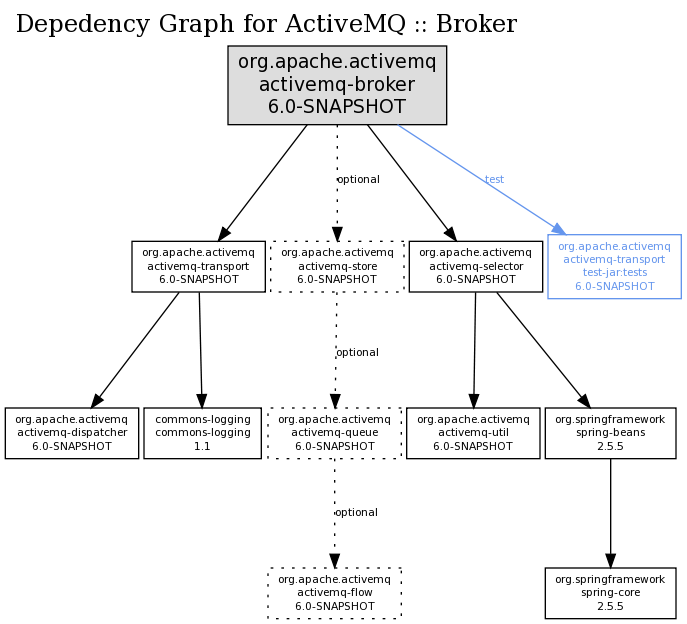
The following graph was generated using graph:project. Notice that the different dependency types are displayed differently. When using graph:reactor on multi module build, you will understand why the project's modules are displayed a little larger.

To create a graph on any maven project you can just type
$ mvn org.fusesource.mvnplugins:maven-graph-plugin:RELEASE:project
Or you can add the Maven Graph Plugin to your 'graph' profile in your project's pom:
<project>
  <profiles>

    <profile>
      <id>graph</id>
      <pluginRepositories>
        <pluginRepository>
          <id>mvnplugins.fusesource.org</id>
          <url>http://mvnplugins.fusesource.org/repo/release</url>
          <releases>
            <enabled>true</enabled>
          </releases>
        </pluginRepository>
      </pluginRepositories>
      <build>
        <plugins>
          <plugin>
            <groupId>org.kuali.pom</groupId>
            <artifactId>graph-maven-plugin</artifactId>
            <version>1.0.14</version>
          </plugin>
        </plugins>
      </build>
    </profile>

  </profiles>
</project>
Then you can generated the dependency graphs by running:
$ mvn -P graph graph:project
 -- OR --
$ mvn -P graph graph:reactor
You can exclude certain types of dependencies from being included in your graph by setting some maven properties. For example, to omit the dependencies in the testing scope and dependencies which are optional, you would use the following options:
$ mvn -P graph graph:reactor -Dhide-scope=test -Dhide-optional=true
To see the full list options options supported to customize your graph output please see the goal reference.